Smart Investment Analysis: Insight into Markets, Seize Opportunities
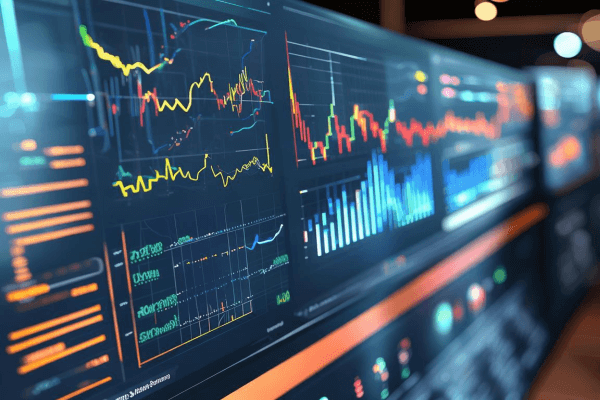
Move beyond traditional indicators. We use complex algorithms to deeply mine Candlestick patterns, helping you discover hidden investment opportunities in the market.
Get Started NowOur Core Advantages
How It Works
Data Collection and Cleaning
Access broker-grade precise data sources, obtain massive historical Candlestick data in real-time, and perform strict cleaning and standardization to ensure data quality.
Complex Algorithm Analysis
Apply proprietary complex quantitative algorithms to perform deep graphical computation and pattern recognition on historical Candlesticks of individual stocks and sectors, surpassing traditional indicator limitations.
Generate Intelligent Reports
Automatically generate detailed daily analysis reports for individual stocks and sectors, intuitively displaying identified investment signals with visualization charts for better understanding.
Assist Your Decisions
With precise analysis and intuitive presentation, help you quickly understand market trends and make smarter investment decisions.
User Reviews

"Smart Investment Analysis's Candlestick pattern recognition is so powerful! Cup and handle patterns that were hard to spot before are now clear at a glance, greatly improving my stock selection efficiency!"
- Mr. Zhang, Senior Investor

"The sector analysis feature helps me quickly grasp market hotspots. Combined with RPS analysis, my investment decisions are much more precise. Thank you so much!"
- Ms. Li, Quantitative Investor
Start Your Smart Investment Journey Now!
Say goodbye to blind investing, arm your investment strategy with data and algorithms.
Try for Free